Quality metrics overview
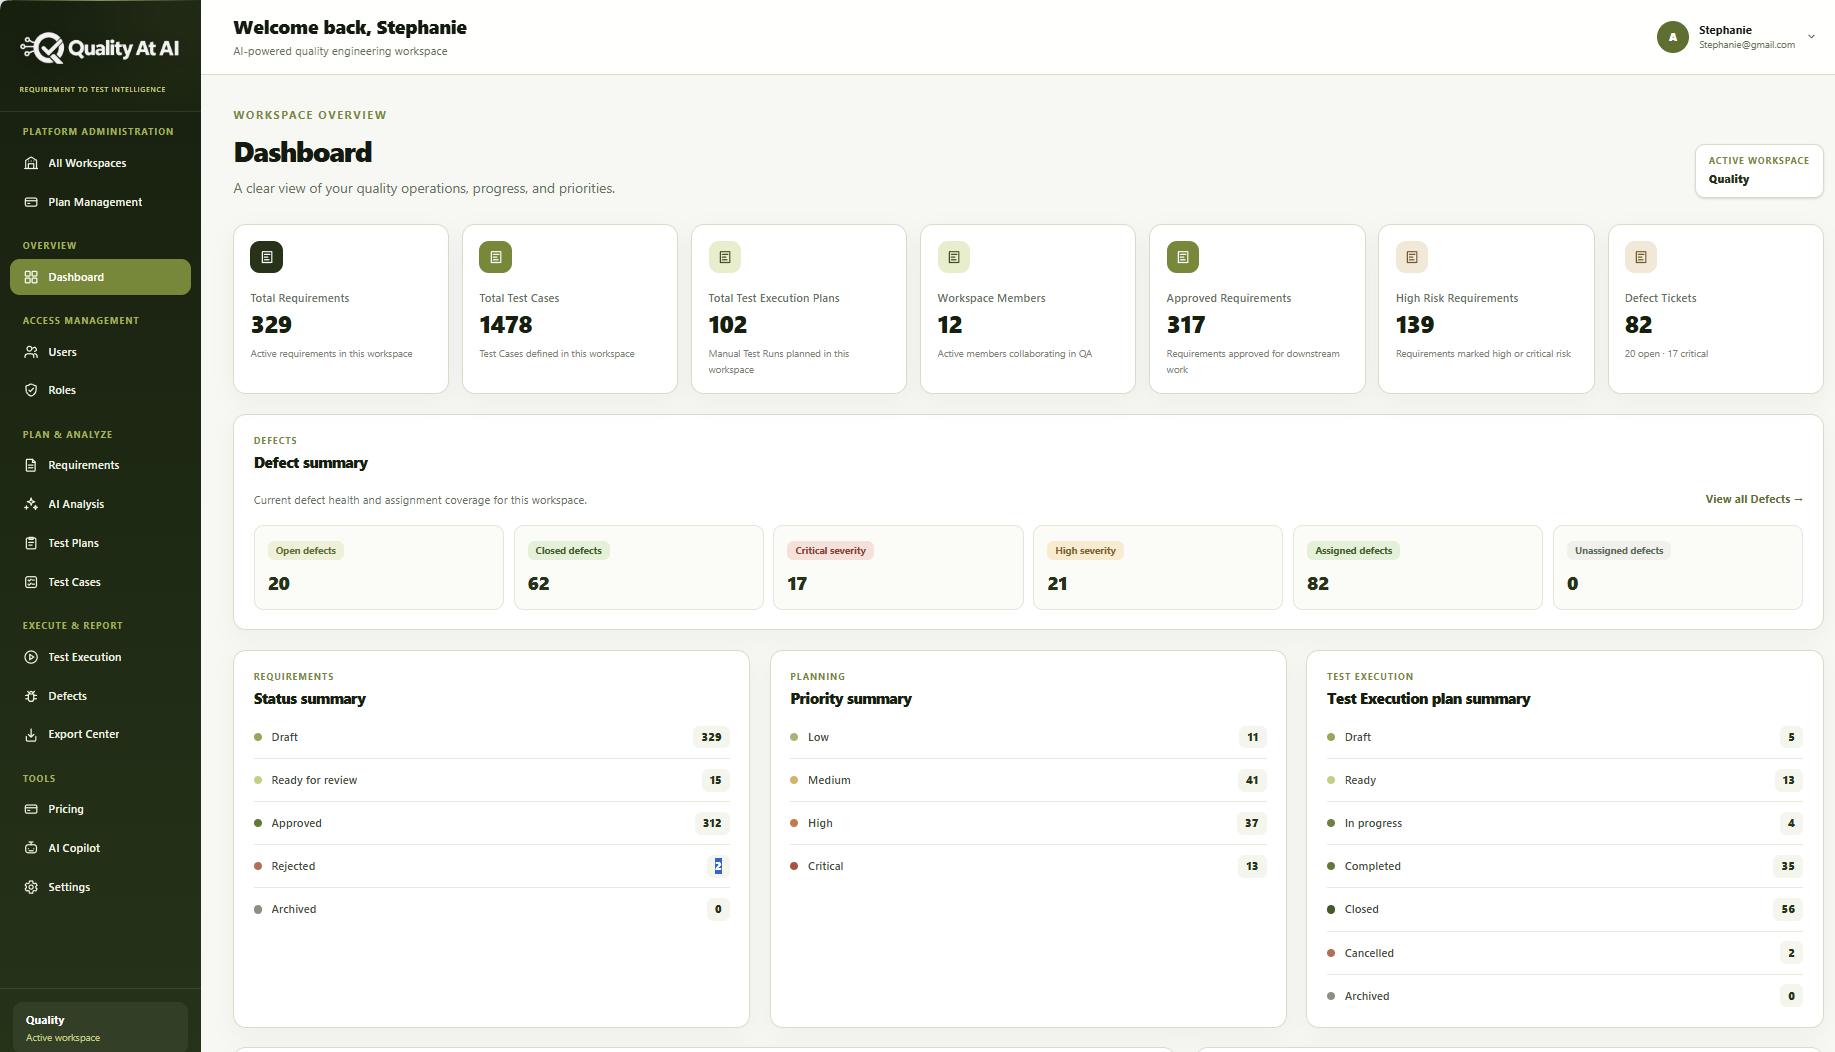
See requirements, test cases, execution plans, workspace members, approvals, and defects together rather than checking separate screens.
Bring the signals behind a release decision into one workspace view—from requirements and test coverage to execution, risk, and defects.
The dashboard gives product, engineering, and QA teams a shared starting point. Read the summary, then follow a metric into the work that needs attention.
See requirements, test cases, execution plans, workspace members, approvals, and defects together rather than checking separate screens.
Understand how requirements are distributed across draft, review, approval, rejection, and archival stages.
Spot high-priority and critical requirements so the team can focus its review and testing effort.
Follow test-plan progress and the current mix of open, closed, severe, assigned, and unassigned defects.
The example dashboard shows metrics, requirement health, priorities, execution plans, and defects in one view.
A shared overview helps teams decide what to investigate next—not just count what happened.
Start with your next set of requirements or talk with the Quality At AI team.